Hey Everybody! It's Ashlynn here, the scribbler for today.
Todays class started off with these questions...
1) A ball is thrown up in the air with a velocity of 96 ft/sec from a height of 112 feet. The height of the ball for t>0 is given by
h(t) = -16t2 + 96t + 112
a) Find the maximum height the ball attains
The equation is a parabola so we find the x-coordinate of the vertex using:
x = -b / 2a
= -96/ 2(-16)
x = 3
We found that, then we can find the y- coordinate by plugging 3 into the equation
h(3) = -16(3)2 + 96(3) +112
= 256
therefore the maximum height is 256 ft.
b) Find the average velocity between t=0 and t=7.
Avg. velocity =(h(7) - h(0) ) / (7-0)
= 0 - 112 / 7
= -16 ft./sec
c) Find the velocity at t=3
There were a number of ways Mr. K showed us on how to answer this question.
i) h(3.001) - h(3) / (3.001 - 3)
= -.016
ii) Was to use your slope program in your calulator
iii) lim g(x+h) - g(x) / h
h->0
lim [ (-16(x+h)2 + 96(x+h) + 112) - h(t) ] / h
h->0
If you expand it you find the derivative fuction that help you determine the
velocity at any point.
h ' (t) = -32t +96
h ' (3) = -32(3) +96
= 0
h ' (3)= 0 so the slope of the tangent at t=3 is 0.
iv) Find the average velocity between two estimates.
lim h(3.001) - h(3) / (3.001 - 3)
h->0 = 0.016
lim h(3) - h(2.999) / (3 - 2.999)
h->0 = 0.016
( 0.016 +0.016 ) / 2
= 0.016
v) use your calculator to draw the tangent at x=3
1) [2nd] Draw
2) 5:tangent
3) x = 3
4) [enter]
You will find that the slope of the tangent line is 0.
d) Estimate, to the nearest hundredth, the velocity of the ball at the instant it hits
the ground.
To solve this we use the Quadratic formula
t= -b +/- squareroot ( b2 - 4ac) / 2a
t = -96 + squareroot ( 962 - 4(-16)(112) / 2(-16)
= 7
t = -96 - squareroot ( 962 - 4(-16)(112) / 2(-16)
= -1
* t>0 so we can discard t = -1.*
2) A function f has a derivative f '(x) = x3 - 3x +1. Use your calculator to sketch f'.
a) Where on the graph of f' are the tangent lines horizontal?
I would include a graph but, I can't put the image on here. So, you can see it in
your calculator
On the graph you would look at the roots because it is a derivative function of f.
The roots are where the slope of the tangent lines would equal zero.
The roots are x = -1.8794, 0.3473, and 1.5320.
b) Suppose f(-1)=5. Write the equation of the tangent line to f at x=-1.
f(-1)=5 , x=-1 (-1,5) <---- point
f '(-1)= (-1)3 - 3(-1) +1
f '(-1)= 3 <---- Slope
We have a point and a slope, so we use the point-slope formula and use the point
(-1,5) and slope of 3.
y - y1 = m (x - x1)
y - 5 = 3 (x +1)
* We can leave the equation as it is *
3) a) f(2)=3 and f '(2)=4. Write an equation for the line tangent to f at x=2.
f ' (2) =4 <--- Slope
The method is the same as question 2 b.
(2,3) and slope of for f is 4.
y - y1 = m (x - x1)
y - 3 = 4 (x-2)
b) f(x)=x2 and f'(x)=2x. Write an equation for the tangent line to f
at x=3.
f(3) = (3)2
= 9
f ' (3) = 2(3)
= 6
y - 9 = 6(x - 3)
c) Suppose f(x)= 2e3xFind an equation for the tangent line to f
at x=0.
f(0) = 2e3(0)
= 2
To find the slope we can use our calculator to find the derivative at 0:
1) hit [math]
2) 8:nDeriv(
3) (y1, x, 0)
4) [enter]
you will find that the slope is 6.000009
we now have a slope, 6, and a point (0,2)
y - 2 = 6(x-0)---> y - 2 = 6x
Homework for tonight is section 2.4 odd questions + 10 & 14. The next scibe is going to be done by... Crystal.
October 04, 2006


October 03, 2006
Blogging On Blogging
Hi. I'm BOB. Phew! I'm glad I made it. Thank you all for being so patient and waiting for me. Now that I'm here, I'll stay with you for the rest of the semester ... we're really going to have FUN learning together! ;-)
An interesting class today. We looked at a distance/time graph showing Charlotte's road trip to Gimli. Since Charlotte's average velocity over the entire trip was about 40kph, everyone thought she was a slow driver, or rather "a cautious driver." When we looked at the graph closer, finding her average velocity over smaller and smaller time intervals both at the end and the beginning of the trip our opinions changed. Charlotte isn't a cautious driver ... she's a cRaZy driver; who arrives at their destination going almost 200 kph?!? I think we all learned something though ... it's important to know how to look at a graph and examine the details. A friend of mine always says: "It's all in the details." ;-)
We were talking about exactly what sort of post you're supposed to make to get that mark on your test. The kind of post I'd like you to make should have one or more of these characteristics:
Your posts do not have to be long. I'm far more interested in the quality of what you write rather than the quantity.
Blogging Prompt
To help us along our blogging journey I've decided that I will also occasionally post a Blogging Prompt. It will be easy to find because I'll always put it under a heading like the one above this paragraph. Feel free to create your own Blogging Prompt for the rest of us if you like. If it's a really good one (i.e. has rich possibilities for blogging) we'll count it as your post. ;-) Here's my first one:
This sort of compare and contrast exercise can be made easier to do using Venn Diagrams. Draw three large overlapping circles. List the similarities in the appropriate overlapping sections and the differences in the non-overlapping sections. If you like, you can use this web tool to do it online. If you do blog about this prompt and want to post your diagram we'll talk about how to post pictures sometime in class. ;-)
Happy Blogging!
An interesting class today. We looked at a distance/time graph showing Charlotte's road trip to Gimli. Since Charlotte's average velocity over the entire trip was about 40kph, everyone thought she was a slow driver, or rather "a cautious driver." When we looked at the graph closer, finding her average velocity over smaller and smaller time intervals both at the end and the beginning of the trip our opinions changed. Charlotte isn't a cautious driver ... she's a cRaZy driver; who arrives at their destination going almost 200 kph?!? I think we all learned something though ... it's important to know how to look at a graph and examine the details. A friend of mine always says: "It's all in the details." ;-)
We were talking about exactly what sort of post you're supposed to make to get that mark on your test. The kind of post I'd like you to make should have one or more of these characteristics:
- A reflection on a particular class (like the second paragraph above).
- A reflective comment on your progress in the course.
- A comment on something that you've learned that you thought was "cool".
- A comment about something that you found very hard to understand but now you get it! Describe what sparked that "moment of clarity" and what it felt like.
- Have you come across something we discussed in class out there in the "real world" or another class? Describe the connection you made.
- Respond to a Blogging Prompt I posted. (see below)
Your posts do not have to be long. I'm far more interested in the quality of what you write rather than the quantity.
Blogging Prompt
To help us along our blogging journey I've decided that I will also occasionally post a Blogging Prompt. It will be easy to find because I'll always put it under a heading like the one above this paragraph. Feel free to create your own Blogging Prompt for the rest of us if you like. If it's a really good one (i.e. has rich possibilities for blogging) we'll count it as your post. ;-) Here's my first one:
We've learned about three different ways to represent a function; symbolically, numerically and graphically. Blog a brief paragraph identifying ways in which these three representations are similar. Blog a second paragraph outlining the ways in which they are different.
This sort of compare and contrast exercise can be made easier to do using Venn Diagrams. Draw three large overlapping circles. List the similarities in the appropriate overlapping sections and the differences in the non-overlapping sections. If you like, you can use this web tool to do it online. If you do blog about this prompt and want to post your diagram we'll talk about how to post pictures sometime in class. ;-)
Happy Blogging!
Scribe Post
It's Mark again, and this time it's the real deal...
Question ONE
Charlotte drove to Gimli over the weekend. The Graph shows her distance travelled over time.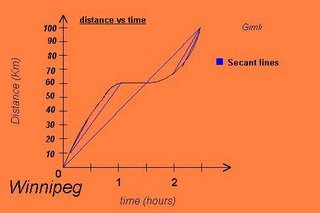
NOTE: people may have differences in solutions, relating to what points they chose.
A) What was her average speed:
i)Over entire trip? What kind of driver is she?
Avg speed=40km/h for the entire trip
to solve for the average speed, take two points and find the difference between the two points. Divide the difference in distance by the difference in time. This is also known as:
Rate of change, delta y/ delta x, slope
ii) Over the first hour?
45km/1hr= 45km/hr during the first hour
iii) last hour?
(100km-45km)/1hr= 55 km/hr during the las hour
iv) First half hour?
38km/0.5hr= 70km/hr during first half hour
v)over last half hour?
(100km-50km)/0.5hr=100km/hr
B) What happened at the one hour mark? How long did it last?
At the one hour mark, Charlotte stopped driving. You could ttell she stopped because she was not gaining or losing distance starting at that time. She stopped for about thirty minutes
What would happen... ?
If we found Charlotte's speed the first quarter of an hour ?
20km/0.25hr=80km/hr
If we found Charlotte's speed the first eighth of an hour (7min!!!)?
15km/0.125hr=120km/hr
If we continue to narrow down a specific time, the secant line begins to transform into the tangent line. The tangent line finds the velocity of one time period.
Vocabulary
SECANT- A line that cuts a graph in 2 or more places. Finding the slope of the secant line gives us the velocity for a time interval (distance vs. time graphs). Secants can be applied to any graph, we just use "distance vs. time" because it is easy to understand.
TANGENT- A line that touches one point on a graph. The slope of the tangent line determines the instantaneous value for one plave in time (i.e. velocity at 20 seconds).
CONCAVITY- The "bendyness of a graph". if the curve of a graph opens down, we call the curve concave down. if the curve of a graph opens up, we call the curve concave up.
DERIVATIVE- The instantaneous point on a tangent line, rate of change at one point in time.
Not included in this SP, is the symbolic method of solving a graph.
HW: section 2.1 odds, 6 and 12
Same Sp for tomoorow as i posted on the test Sp
You are probably wondering why i chose such a large font. I chose this font size because it makes you want to read the text. The letters are not so tiny. I have noticed that if a Scribe post looks really long i don't feel like reading it all. Now you can scan easily for BIG key words.=)
Question ONE
Charlotte drove to Gimli over the weekend. The Graph shows her distance travelled over time.

NOTE: people may have differences in solutions, relating to what points they chose.
A) What was her average speed:
i)Over entire trip? What kind of driver is she?
Avg speed=40km/h for the entire trip
to solve for the average speed, take two points and find the difference between the two points. Divide the difference in distance by the difference in time. This is also known as:
Rate of change, delta y/ delta x, slope
ii) Over the first hour?
45km/1hr= 45km/hr during the first hour
iii) last hour?
(100km-45km)/1hr= 55 km/hr during the las hour
iv) First half hour?
38km/0.5hr= 70km/hr during first half hour
v)over last half hour?
(100km-50km)/0.5hr=100km/hr
B) What happened at the one hour mark? How long did it last?
At the one hour mark, Charlotte stopped driving. You could ttell she stopped because she was not gaining or losing distance starting at that time. She stopped for about thirty minutes
What would happen... ?
If we found Charlotte's speed the first quarter of an hour ?
20km/0.25hr=80km/hr
If we found Charlotte's speed the first eighth of an hour (7min!!!)?
15km/0.125hr=120km/hr
If we continue to narrow down a specific time, the secant line begins to transform into the tangent line. The tangent line finds the velocity of one time period.
Vocabulary
SECANT- A line that cuts a graph in 2 or more places. Finding the slope of the secant line gives us the velocity for a time interval (distance vs. time graphs). Secants can be applied to any graph, we just use "distance vs. time" because it is easy to understand.
TANGENT- A line that touches one point on a graph. The slope of the tangent line determines the instantaneous value for one plave in time (i.e. velocity at 20 seconds).
CONCAVITY- The "bendyness of a graph". if the curve of a graph opens down, we call the curve concave down. if the curve of a graph opens up, we call the curve concave up.
DERIVATIVE- The instantaneous point on a tangent line, rate of change at one point in time.
Not included in this SP, is the symbolic method of solving a graph.
HW: section 2.1 odds, 6 and 12
Same Sp for tomoorow as i posted on the test Sp
You are probably wondering why i chose such a large font. I chose this font size because it makes you want to read the text. The letters are not so tiny. I have noticed that if a Scribe post looks really long i don't feel like reading it all. Now you can scan easily for BIG key words.=)
BOB
i was confussed i thought we had to the BOB differently, i never knew it was the same thing as last year :( but since everyone else is did it i might as well do it too even though its too late . so the test was okay i guess there were some parts that were kinda complicating. for this unit i tried to do all of my homework. it was basically kind of a review of what we had learned last year with some new things also. i do admit that i did forget alot of things and it took me a while to get and truly understand. the thing that i had the most trouble with was the rational functions. graphing the sin and cos functions are pretty easy. overall this unit wasn't hard but difficult at the same time lol.
Blogon Blog #1
So, Bob PROMISED to come this afternoon according to Mr.K... But since everyone else bob'ed without Bob's instructions, I guess I might as well, and I'm familiar already with it. Maybe Bob really was abducted by aliens.
Anyway, in today's class we started a new unit on Derivatives. This is where the real Calculus begins! It's pretty interesting, going into great depth within graphs. The test we had yesterday felt like a bummer to me. I had no idea to what "lim x->infin. x=8" meant as it was the first time I saw it in my life, not unless it had something to do with series. And on about 4 multiple choice questions I had to practically guess because I was out of time. Also I realised that I did something wrong on the graph just seconds after the bell rang (why do I second guess myself, I got it right the first time.). What bugs me the most about it, is that I should already know this as it is just a review from Pre-cal. I have my eyes peeled and my ears taped open focusing as hard as I could now. I really need to turn it up a notch. I hate how the best learning experiences are from mistakes that cost us marks! Ouch...
... There's always the next test.
Anyway, in today's class we started a new unit on Derivatives. This is where the real Calculus begins! It's pretty interesting, going into great depth within graphs. The test we had yesterday felt like a bummer to me. I had no idea to what "lim x->infin. x=8" meant as it was the first time I saw it in my life, not unless it had something to do with series. And on about 4 multiple choice questions I had to practically guess because I was out of time. Also I realised that I did something wrong on the graph just seconds after the bell rang (why do I second guess myself, I got it right the first time.). What bugs me the most about it, is that I should already know this as it is just a review from Pre-cal. I have my eyes peeled and my ears taped open focusing as hard as I could now. I really need to turn it up a notch. I hate how the best learning experiences are from mistakes that cost us marks! Ouch...
... There's always the next test.
October 02, 2006
Scribe Post
Hello everyone, this is Mark and i am your scribe for today.
Well to start things off, i will talk about BOB. I am not sure what is going on, but the expressions from everyone today was... we were all lost! Mr. K, mostly everyone in the class was anticipating you to post the BOB post since Friday. The constant checks everyone made to the blog, to see if the "How-to BOB" post was up. Everyone who did not see the post, including me, assumed that the bob was not to be done.
OUR CLASS
Today we had Mr. Clark as our substitute teacher. Today was also test day. I will talk about some problems i had on the test. feel free to write in your comments about the test.
On the test, i had a hard time figuring our the answer for number one. i kept looking at (a ), (b) and (d) as possible answers. i plugged the answers into the equation, but it did not even work out. I finally chose (d) as my answer.
There was also another question, where i had to figure if the output was possible for the equation. I think this multiple-question was on the top of page 2.
This was the worst test i took for math. Worst for me because i had a cold and it is harder to think. I also spent too much time on the multiple, when, when i should have spent about 3 minutes maximum on each one. I had to rush the last part of the test and also answer some unanswered multiple.
Overall, i think the test was mediocre. I just had trouble with 2 multiple questions and everything else was not bad.
If you had any problems you want to discuss, pls post your comments freely. =)
ICHOOSEYOUJESSICAJILL
Well to start things off, i will talk about BOB. I am not sure what is going on, but the expressions from everyone today was... we were all lost! Mr. K, mostly everyone in the class was anticipating you to post the BOB post since Friday. The constant checks everyone made to the blog, to see if the "How-to BOB" post was up. Everyone who did not see the post, including me, assumed that the bob was not to be done.
OUR CLASS
Today we had Mr. Clark as our substitute teacher. Today was also test day. I will talk about some problems i had on the test. feel free to write in your comments about the test.
On the test, i had a hard time figuring our the answer for number one. i kept looking at (a ), (b) and (d) as possible answers. i plugged the answers into the equation, but it did not even work out. I finally chose (d) as my answer.
There was also another question, where i had to figure if the output was possible for the equation. I think this multiple-question was on the top of page 2.
This was the worst test i took for math. Worst for me because i had a cold and it is harder to think. I also spent too much time on the multiple, when, when i should have spent about 3 minutes maximum on each one. I had to rush the last part of the test and also answer some unanswered multiple.
Overall, i think the test was mediocre. I just had trouble with 2 multiple questions and everything else was not bad.
If you had any problems you want to discuss, pls post your comments freely. =)
ICHOOSEYOUJESSICAJILL
BOB
Ok so I'm not the only one who's confused. This weekend just flew by for me. But I've been checking on this BOB thing every day, at least three times a day and it's still not here. So does this mean no test? OR just no question regarding BOB on it? Hmmmm, well I posted this up because Anh started it all.... haha. Anyway, about the first unit of Calc Ap; I've been doing my hmwk, and listening in class so I think I'm pretty good to go if we have our test today. The only thing I'm not so sure on is identities... well the whole circle thing. I still gotta review the patterns and yeahh but other than that it's all good!!! So I hope this whole BOB thing gets cleared up in class, and if the test is today, GOOD LUCK GUYS =)
Subscribe to:
Posts (Atom)


