October 09, 2006

Scribe Post: Day 20 - Lesson: The Derivative Function

Hi everyone! HAPPY THANKS GIVING DAY!!! It's Katrin and I will be your scriber yet again... =]

Today, Mr. K started off with a "The Scribe Post Hall of Fame" debate, sort of thing. He asked the class, "What is a reasonable amount of votes for a peron's scribe to be inducted into the Hall of Fame?" People in the class had a lot of great ideas and I thought it was neat that that session was recorded. In the end, our class unanomously decided that at least 5 votes must be made in order for a person's scribe to be in the Hall of Fame.

In order to be inducted in the Hall of Fame:

*Must have at least 5 votes.*

Conditions:
1) Of the 5 votes, the majority of votes must be made by students, the rest can be external votes (Mr. K, teachers, people from all over the world, etc.).
2) When voting, person must say WHY a certain person's scribe is Hall of Fame worthy.
3) You cannot vote for someone just because your their friend, you have to have a reason.

------------------------------------------------------------------------------------------------


Daily Questions ---> Lesson: The Derivative Function:

1) If the average rate of change of a function f from x=1 to x=9 is known to be 3, and if f(1)=5 , find the value f(9).

WORK:

Like always use the slope formula -------------->


Then plug it in like such:
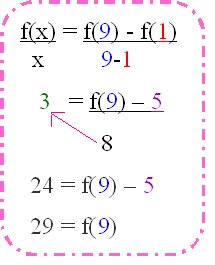


Remember:

~ f(x) = 3
...x

~ f(1) = 5


GRAPH:


-----------------------------------------------------------------------------------------------


2) g(x) = x 2 + 5x

Find the average rate of change of g from x=a to x=a+h by calculations and simplifying:
lim.....g(a+h) - g(a) <--- numerator
h->0......(a+h) -
a
<--- denominator


EXAMPLE GRAPH Mr. K drew on board:


.
.

WORK:


Note:

1)*x = a*


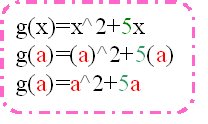
2) g(x) = x2 + 5 x OR g(a) = a 2 + 5a


-plug in"a" in the function, g(x) = x2 + 5 x


.


.


.

.

3)*since x=a+h then we can say that a=a+h since x=a*

-plug in (a+h) in to where you see "a" in the fuction g(a) = a 2 + 5a
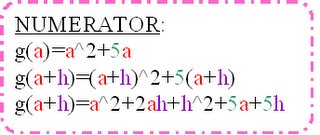
NOTE:

*The equation, g(a+h), in the box applies to a portion of the numerator in the equation,

lim.....g(a+h) - g(a)
h->0......(a+h) - a
The rest of the numerator, g(a), which equals to a 2 + 5a has its work shown below in step #5.

.
.
4) Denominator: (a+h) -a
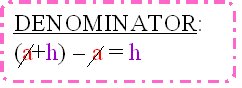

NOTE:
*"a" cancels out.


.

.

5) Now we just do a matter of substitution in the equation given below and then we do some cancelling out.


lim.....g(a+h) - g(a) <--- numerator
h->0......(a+h) - a <--- denominator
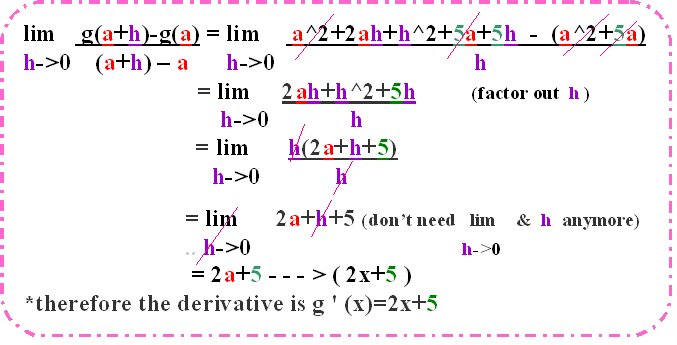

Sorry if this is too small or if it appears blurry !

-We don't need lim h-> 0 & h anymore since its a value/number that's really really close to zero... so technically we don't need it anymore.


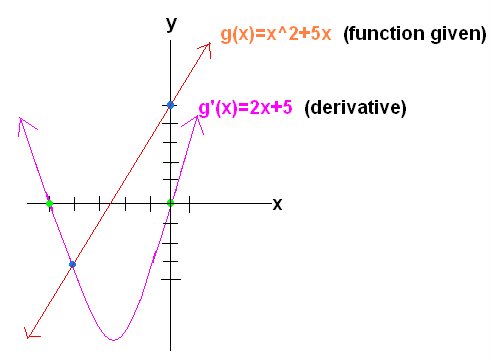
GRAPH of function g(x)=x2 + 5x and
the derivative of that fuction: g'(x)=2x+5:


.
.

We ran out of time in the end to finish the last question. Mr. K said he would post the answers up for that.

.

HOMEWORK: 2.3 odd #'s & # 12

.

The person I choose to do the next scribe is Ashlynn! :)

October 05, 2006

BOB

This is in response to Mr. K's Blogging Prompt. This will be brief but I'll do my best to state what I think. Here it goes.

Symbolic, numeric and graphical representations of functions are three different ways of showing the same thing. I see them as a part of our 'math arsenal', ready to be used at our disposal. For example, which of the three would we use to describe our journey from Winnipeg to Gimli? We're talking about real life right now.. Are we going to show a graph of our journey? Concavities.. horizontal lines.. Should we show an equation? "Oh hi there John, on my way to Gimli my journey could be described by f(x) = 2x3 ". Imagine someone doing that. I guess not. In this case, I'd show John a chart with my distance in one column, and time on the other. If he sees my distance constantly increasing, he knows im moving. If he sees it become constant, he'd know I stopped. They all represent the same thing, but we use what makes sense given our situation.


How are they different. Well, I'd put it this way. Graphs, equations and numbers are different languages. Equations are precise and general ways of describing values. For example, in the real world, given an equation, when we're given ANY input, we can easily get an output. Graphs. Graphs appeal to our eyes. We 'see' what's being described. I said given an input, we get an output through an equation. We can do the same thing with a graph, but for example, given the graph of f(x) = 1000x + 49. If a person wants to find f(500), MAN that would take a LOOOOONG time to find the answer through a graph. Table of values. They're specifically about inputs and outputs. Given one thing, you get another. Without crossing the boundaries between these media (graphs, equations, t of v), you can't really understand something fully with a table of values. You can precisely say, however, what an input would give you. Just look for it. Okay, getting late. Toodles.

BOB

Blogging is very important because it shows everyone what we've learned everyday in class. It's been very helpful to me because I was having a hard time understanding the concepts in AP Calc. Its very hard for someone to understand the concepts in a snap if he or she didnt take grade 12 pre cal yet. =D The posts helped me alot especially while doing the homeworks.

I learned alot from this class. Even though I had no idea what the teacher is talking about at first, I was able to study the concepts well. I also learned how to use my graphing calculator and how to apply it's functions during class discussions. I also learned that the calculator is not to be trusted all the time. It can alter your results because its not smart! Another thing is that Math is the science of patterns. It means that everything in math has a pattern that would help us understand things better. I'm still having trouble understanding the unit cirle. =P

So far, everything is fine especially the new unit, Derivatives. I hope everyone will do their best! =D

The derivative function

Class started off with completing some questions off of the board...


1) Suppose f(x)=√(x)
calculate the average the rate of change between:
a) x=9.0 and x=9.1
b) x= 8.9 and x=9.0
c) Use your answers to a) and b) to approximate the instantaneous rate of change at x=9.

Solution:
1)a) (3.0166-3.0)/(9.1-9.0)= 0.166
b) (3.0-2.9833)/(9.0-8.9)= 0.167
c) (0.166+0.167)/2= 0.1665


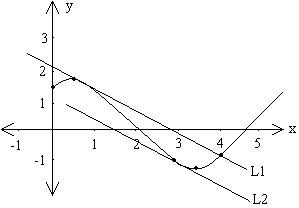
2)a) On the given of f sketch a line whose slope is (f(4)-f(1)/4-1) label the line L1.
b) Now sketch a line whose slope is lim h->0 (f(3+h)-f(1)/h) label the line L2.
* lim h->0, refers to the fact that h gets closer to zero but never gets there.

3) If g(x)=│x^4-16│, what can you say about the values:
a) g'(4)
b) g'(2)
c) g'(0)

Solution:

a) postive number, derivative is 256.

b) derivitive should not exist although the calculator gives you an answer you must discard it because the calculator is stupid.
c) horizontal line, slope is zero.

*derivative- to find the slope of tangent line.


Mr.K then handed out a worksheet on The Derivative Function which is to be done for homework.


Here are the questions from the worksheet...

Investigation 1

Consider the function f(x)= x^2-2. Using your calculator, graph the function. Using the [DRAW]:[Tangent] feature, calculate the slope of the tangent line for x= -3, -2, -1, 0, 1, 2, 3.


Consider the relationship between x(the values in the first row) and the slope of the tangent (the values in the third row). Find a function (f '(x)) that relates the tow rows in the table. Use your calculator to graph both functions.


Investigation 2

Consider the graph below. Estimate the slope (the derivitive) of f for all integral values of x illustrated. Plot these new ordered pairs (f ') on top of the given graph.


Investigation 3

Consider the table of values below. Use the data in the table and the difference quotient to estimate the value of f '(x) for each given value of x. Complete the table of values for f '(x).


Use the statistical graphing feature of your calculator to plot both table of values as broken line graphs.

Investigation 4

The derivative of a function f(x) can be defined as the limiting value of the difference quotient as h approaches 0: f '=lim(h->0) ( f(x+h)-f(x) )/h. Use this definition to determine the derivative of f(x)=1/x algebraically. Use your calculator to graph both functions.

Tomorrow's scribe is Katrin =)

Scribe Post

Hey guys, sorry for the big delay on my scribe post. I was having some technical difficulties with my computer, my notes and with some of the calculator work, so please accept my apology. On the up side, to compensate for the delay on my scribe post, I was actually on time for class for once. It shouldn't have to be a rarity but, I'm trying.

Alright, so to start our class, we picked up on our derivatives unit and started off with a couple of problems given to us on the board.

QUESTIONS

1. A ball is dropped from a height of 400ft and falls towards the earth in a straight line. In t seconds, the ball falls a distance d(t) = 16t2 feet.

a)How long does it take the ball to hit the ground?
b)What is the average velocity of the ball during the time it is falling?
c)Estimate the instantaneous velocity of the ball when it hits the ground.

2. An object travels in such a way so that its position at various points in time are given in the table:


a) Find the average velocity of the object between t = 1.3 and t = 1.9.
b) Estimate the instantaneous velocity at t = 1.9.

SOLUTIONS

1. Keep in mind, this problem is similar to the one we were working on the day before, with Charlotte's driving trip to Gimli.

a) To figure out how long it takes for the ball to hit the ground, we know that it'll hit the ground at 400 ft, so we simply take 400 ft and plug it into our given equation to find the time it takes.

d(t) = 16t2
400 = 16t2 [plug in 400 as our output]
25 = t2 [divide both sides by 16]
5 = t [square root each side]

Hence, our answer is that it takes 5 seconds for the ball to hit the ground.

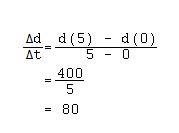
b) We take the rate of change formula and take the two values that we already know. We know that when x is 0, y is 0, and when x is 5, y is 400.

c) We can estimate that the instantaneous velocity is 160.

2. a) Again, we use the rate of change formula to figure out the average velocity.


b) We can estimate that the instantaneous velocity at t = 1.9 is -2.


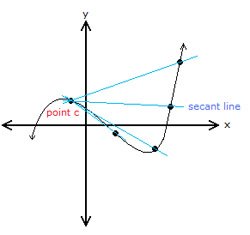
Then, we talked about secant lines and tangent lines. Given the graph to the left as an example, we want a tangent line at point c. If we take various points of the function and connect it to point c with secant lines, we are getting infanantly close.

If you take a fixed point, and a point on a curve and create a secant line that moves infinitely close, we create a tangent line.

The slope of the tangent line gives us the instantaneous rate of change. We created a way for us to find the tangent line of any value by programming our calculators.


We were given an example to plug into our y1 coordinates, which when plugged in gave us a curve [sorry, but I didn't write down the example down right]. We wanted to get closer to one, so we zoom in a number of times until the curve started to look like a straight line.

To get our little program going we press [prgm] and selcet NEW at the top. We want to call it SLOPE. At the top of your screen, it should say PROGRAM : SLOPE. Press enter and you should be on a new line with a coland automatically beginning it. You have to input these "instructions" for the calculator, hitting enter to start each new line:

:[TRACE]
:X[STO]A
:Y1[STO]B
:[TRACE]
:X[STO]C
:Y1[STO]D
(D-B) / (C-A) [STO] S
:Disp "SLOPE", S


Trace is the blue button underneath your screen.
Hitting store on the calculator will display an arrow on your screen.
We uses the alpha key to punch in the letters.
To get th "Disp" command, we hit [prgm], use the right arrow button and arrow to "I/O"(it stands for inputs/outputs) and Disp should be the 3rd choice down.

When we were done we just 2nd quit and were done with creating the slope. We then used our example and used the slope program created to find the tangent line at -1.

Our homework that was assigned to us was section 2.2, all odd questions including questions 2, 4 and 10. I picked Anh to be the next scribe.

October 04, 2006

BOB

Last year I heard a lot about this scribe posting and wondered what it was all about, during this past month I learned a lot about it. This blogging has really helped and it's only been the first month. The scibe posts are extremely useful especially for students with jobs and other after school activities. Also for people who miss the classes, which we would rarely do of course. When it was my turn to post, I had to really understand the work so it would be clear to the readers. So this gave me the extra push to ask questions and do all of my homework. Overall the blogging is very convienient and extremely helpful.

What I also found interesting was all the different things we could do with the graphing calculator. I have a much better understanding of it. It helped how we learned how the calculator functioned and that sometimes the graphs aren't all that accurate because of the engineering. We have to use our heads to find the whole solution. So we shouldn't rely always on our calculators. We are smarter than them.

I also liked the classes themselves. They're very energetic and easy to pay attention :D Especially like the different methods of understanding complicating calculations; for example the sine dance and even simple devices like divisibility rules. Also all of the hand actions and emphasized words do really help! It's very tough for our minds to wander off in that class.

bob prompt

We've learned about three different ways to represent a function; symbolically, numerically and graphically. Blog a brief paragraph identifying ways in which these three representations are similar. Blog a second paragraph outlining the ways in which they are different.

The way we look at a block is like looking at a rectangular block. Symbolically, numerically and graphically are similar to eachother because they all display a function. They also give information about the function's possible shape.

The differences in the three are easier to see. Graphically, you can see the curvature of the graph (if any) and you can also see where the roots are located. Numerically, you can see the actual values of the roots. Symbolically, you can plug in values to solve the function. You can solve for the roots.

Well that's it for me, i have a headache right now and it's really hard to think =). I know my peers will have better things to compare and contrast.