
First, I'd like to start by greeting someone a Happy, Happy Birthday... HAPPY BIRTHDAY MARK!!!!! I know what you're thinking guys, why didn't he tell us? Anyway, we hope you have a good one XD
In today's class, we were given three questions on the board.
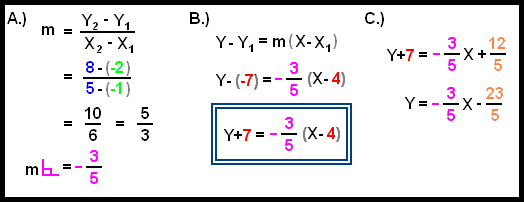
1. Find an equation on the line passing through the point A (4,-7) and perpendicular to the line through the points B (-1,-2) and C (5,8).

A.) When we're given two sets of points, we can find the slope of that line. The question states that point A is perpendicular to point B and C, therefore we need the negative reciprocal of that slope.
B.) In Grade 10, we learned three ways to write an equation. The General Form which is Ax+By+C=0, the Slope-intercept Form which is y=mx+b, and the Point-slope Form. Because we have a set of points A(4,-7) and a slope, that is the form we used to write the equation. REMEMBER; ALWAYS USE THE RIGHT TOOL FOR THE JOB. We could always stop here, at Y+7=-3/5(x-4) ....
C.) I went ahead and figured out what the equation was in Slope-intercept form. Please do correct me if I'm wrong ;)
2. An experiment yields this data:
a) Is the data linear or not? NO, IT ISN'T LINEAR
b)Find a linear model for this data. Estimate the pressure at t=8.5 *CALCULATOR
c)Find a better model for the data. Use your model to estimate the pressure at t=8.5 *CALCULATOR
Explanation;
a)So Mr. K asks, "is this the data linear or not, and how do you know?" Since we were given values, we could answer the question without having to use the calculator. If the data was linear, the differences between the OUTPUT, in this case pressure should be constant. We can see in the table that it varies, therefore the data is not linear.
b) To find a linear for this model, we use our calculator;
- To clear all lists go to [2nd] [+]
- Go to [STAT] [1] [ENTER]
- Enter your data, keeping in mind which lists you put in your x and y values.
- Then [2nd] [Y=] to turn the plot on, making sure you're using the right lists.
- [ZOOM 9] will give you a view of the plots.
- Hit [2nd] [QUIT] then go to [STAT] [right arrow] [4]
- Then [L1] , [L2] , [VARS] [right arrow] [1] [Y1] or whichever one is empty on your Y= screen
- Go to [WINDOW] to make the data fit better.
- For example; Change the xmin to -1, xmax to 10, ymin to 2, ymax to 13.
- Hit [GRAPH]
- Press [TRACE], and [down arrow] so that you're on the line, not the plots.
- Type in 8.5 and you should get y to be 9.4
c) Repeat STEPS 6 - 12 , but instead of pressing [4] in step 6, pick something different to look for the model that best fits the data. Mr. K. said that a Power Regression should get you a better fit.
3. Actual World Population Data:
Fill in the missing values;

Mr. K said that we'll go over this question tomorrow. We don't have homework today guys, yippee!!! But do KEEP IN MIND what we talked about in class. We will be having 2 projects for the year. One being an individual project with the story involving calculus problems that other members in the class have to solve... we need a Mascot name. Also, I have the link for last year's story project so have fun with it... http://calculandquest.blogspot.com/ The other project involves groupwork. We will be making videos about how to solve problems. KEEP IN MIND that there are 4 and only 4 people per group so choose wisely =)
I think I've covered pretty much most, if not everything that we talked about in class... so before I forget, DANNY you are the chosen one... haha.
In Mr. K's words, "That's it, that's all folks. Go out there and commit random acts of kindess" Hopefully you learned something from my post, and see you in class =)
have fun,
Linger


5 comments:
linger! what an awesome post! can you say, scribe post hall of fame? XD. you did really well explaining the questions we did on the board. i love the colour usage because I LOVE COLOURS. =) thanks for all the detailed work. you put a great amount of effort into, by the looks of it. i'm really excited for the projects that we're going to do. makes me wanna say that i love math. ha ha ha.
be happy.
What a post linger! I can only imagine how much time and effort you've put in to it. You also covered all I can remember about our class. Good work.
Just a question for everybody. I know that our scribes used Paint for the graphs and figures on their post. I was just wondering if there was an easier, more efficient way of making them. If there's no other way, of course I'd also use paint, but trust me... you'll see parabolas/hyperbolas/lines... anything that I'd make that will haunt your dreams forever 'cause of their dreadfulness. Please if you have suggestions, I'd very much appreciate hearing about it.
Hi Linger,
Your post is very remarkable! I like the way you used different colors and pics on your post. And also, its detailed and easy to understand. Thanks for the post. It would help me and the others review what we had that day. Keep up the good work.
OMFG (not the the g dash d word), what an awseom scribe post... this is scribe hall of fame material. XD XD XD....can u say XD? i can XD lol this is a scribe post to make you speechless
wow linger! your post is like a rainbow, both beautiful and colourful ;). i never saw this post yesterday because it was posted up so late =P (sleep before 10 its good for you)! but we all can tell you've spent a lot of time on it, since its time stamped 4:15ish and it was up later than that. id say its definitely hall-of-fame material. it is clear and concised just the way i like it. i kind of wished i read it yesterday though, i got so confused with the calculator, i wasnt sure if i was doing it right (but then it was just mr.k's "spelling error" with the wrong values).
and to answer christian's question, the only thing i can think of is getting a mac computer. it's way easier to make curves and such with it.. i wish i had one. and somewhere along the year, you'll hear mr.k say so also.
good stuff.
Post a Comment