 The velocity of an object, in feet per second, is given in the table.
a) Sketch a velocity-time graph from the table.
b) Give lower and upper estimates for distance traveled in the 5 seconds.
c) Estimate actual distance traveled.
d) Show a representation of the lower estimate in terms of a shaded region on the graph.
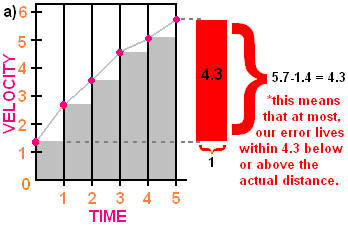 b) LOWER ESTIMATE:
= 17.1 ft.
UPPER ESTIMATE:
(2.7)(1) + (3.5)(1) + (4.5)(1) + (5)(1) + (5.7)(1)
= 21.4 ft.
c) [17.1+ 21.4] / 2
= 19.25 ft.
d) The graph is monotonic increasing, so the lower estimate can be found by the left hand sum. This part is shaded in grey.
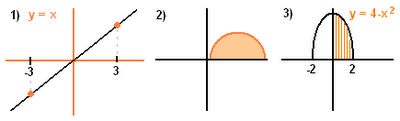 Area is width multiplied by the height. Integral is the signed area under a curve. If you look at the first example, from 0 to 3 the area you would get is 9/2. You would also get the same area from -3 to 0. But if we're talking about integrals, the integral from 0 to 3 is 9/2 and the integral from -3 to 0 is -9/2.
Notice that in the first and second examples, we're easily able to find the area because the functions are shaped nicely... into triangles and a half circle. In the third example however, we get a parabola... so to find the area, we'd have to find the different values at different intervals and add the values together as we've done on our previous questions.
After this, we programmed Riemann's sum (RSUM) into our calculators. As usual, we ran out of time soo if you guys missed the steps, just turn to your handy dandy textbooks and you'll find it all on page 168.
The HOMEWORK for tonight is Excercise 3.2 all ODD questions only. And tomorrow's scribe shall be MARK.


5 comments:
good post, linger! first of all, i'd like to say that i liked your choice of colours, very halloween-y! =) you did a good jop in explaining the last part (i don't know what to call it)...i didn't fully understand it in class but now, i think i do!
yay! happy halloween!
Ooh.. halloween colours :) Thanks for the note Linger, I fixed the day on my post. I was just wondering about that graph with the error shown by the red bar. The error is found by moving all the triangles from the upper and lower estimates, but on the graph you're only showing the lower estimates. I think it would be a little more clear if it also showed the upper estimates. (I'm not sure if I'm right though) And other than that good job :)
Well the reason I only showed the lower estimates, is because that's what was stated to do in the question... but I could do the upper estimate too - another time, cause I have to get ready for work. K byee =)
Hi Linger! I like your halloween spirit! Good job on the scribe and the halloween colors. Btw, thanks for reminding me and Suzanne about the day. Ill go into it asap. Keep up the good work.
This is a great post to follow up your inspirational call to your classmates. Great use of colour and images to explain this Math. I will admit that this math is over my head and a weee bit advanced. I was able to follow what you were saying and appreciated the work you put into this post.
Thanks for working so hard. Your audience (look at the Clustr Map) and it is a large one appreciates your hard work.
Mr. Harbeck
SargentPark School
Post a Comment